GSMA puts storm and flood damage to cell sites at $1.7 billion a year
Storms and floods cost mobile operators $1.7 billion a year. The Register reported that figure on 3 November, and the GSMA expects the annual repair bill for cell sites to pass $3 billion by 2050.
 Sofia MarchettiScience and health
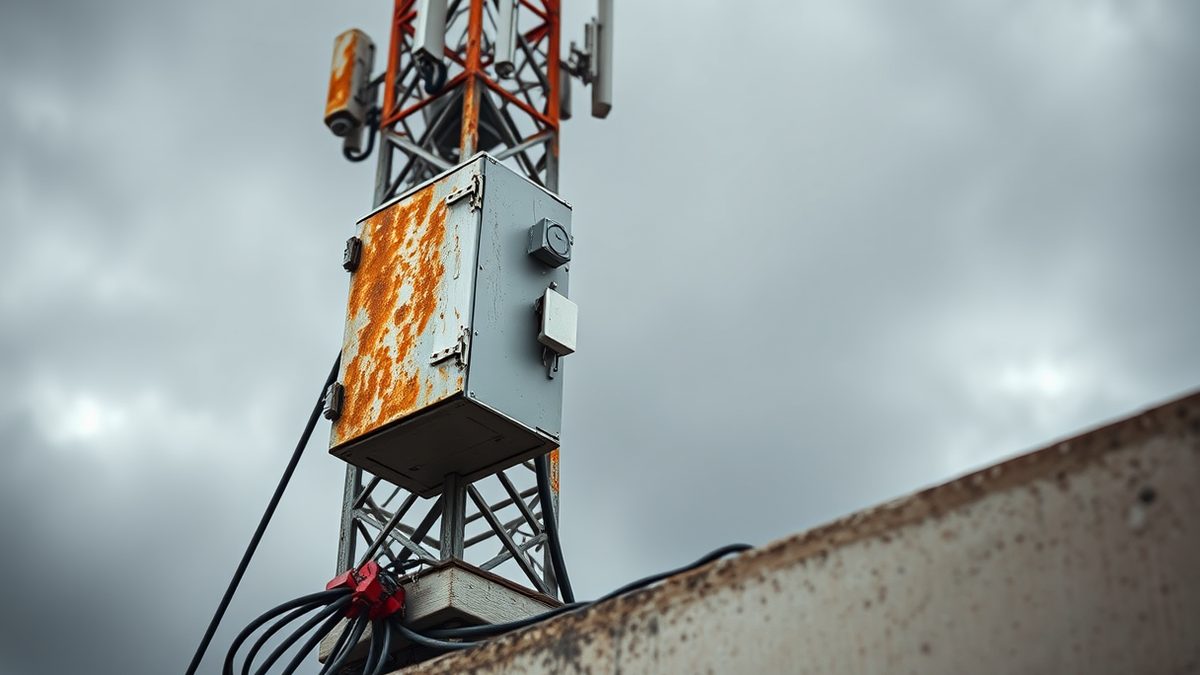
Storms and floods cost mobile operators $1.7 billion a year. The Register reported that figure on 3 November, and the GSMA expects the annual repair bill for cell sites to pass $3 billion by 2050.
A phone is often the fallback when the power fails. The GSMA names the electricity supply as the biggest single vulnerability, so a network is only as reliable as the grid behind it. Nobody has said who absorbs the repair bill, or whether regulators will let operators pass it to customers.
Power, not towers, is the weak point
The GSMA, which represents mobile operators, published the figures in a six-part research series, Futureproofing Connectivity: Climate Risk and Resilience in Telecommunications. The Register reported them on 3 November. Storm damage accounts for $1 billion of the $1.7 billion total. River floods add $577 million and coastal floods $124 million. Under climate conditions expected around mid-century, the GSMA expects storm costs alone to reach about $2.37 billion, three-quarters of all damage. Towers, masts and rooftop sites are exposed to wind, lightning and storm surge. Ground-level equipment floods. High temperatures can overheat radio gear, and heavy rain degrades signal strength.
The report points at the electricity supply as the biggest vulnerability.
Once backup power runs out, a site goes offline. That can take hours, or considerably longer depending on the site. Operators are advised to embed resilience by design. The GSMA published a separate set of policy principles alongside the research and wants governments and regulators to work more closely with mobile operators.
The auditors found the costings thin
The National Audit Office reported on 3 November that UK public bodies expect higher operating costs, higher energy charges and more spending on maintenance and adaptation. Few of them can put a number on those risks, even approximately.
Bodies anticipate costs from damage to assets and infrastructure, driven by extreme weather as well as chronic shifts to higher temperatures and more precipitation, the report said. Physical risks got detailed treatment in the disclosures the NAO reviewed. Transition risks, the costs of moving to a low-carbon economy, were listed but rarely specified. HM Treasury required larger central government bodies to disclose climate-related financial information, and the first reports covered the 2025-26 financial year. Other disclosure rules have applied since 2022. Gareth Davies, head of the NAO, said parliament needs clear information on the resilience of infrastructure, service provision and finances to climate change. He called the reporting requirement an important first step.
Oregon counted days instead of dollars
Oregon took a different measure. The state's health authority compared 2006-2010 with 2021-2025 and counted the days.
Extreme heat averaged 12 days a year in the earlier period and 22 days in the later one. Wildfire smoke went from 11 days to 33. Days with both at once rose from two to nine, which OPB described on 29 October as a quadrupling. The report also noted that 2025 was Oregon's third warmest year since record keeping began in 1895. Gabriela Goldfarb, the Oregon Health Authority's environmental public health manager, called the trends "really eye-opening". She said heat and smoke can affect organs throughout the body, including the heart and the cerebrovascular system, with strokes among the risks.
Seven hundred thousand deaths in one year
The 2026 Lancet Countdown, published on 28 October, estimated that heat was linked to 710,000 deaths in 2023, with more than 70 percent attributed to human-caused warming.
Average annual heat-related deaths rose almost 36 percent to about 540,800 between 2016 and 2023, Gulf News reported. This is the tenth annual edition, with 146 researchers from more than 100 institutions in over 30 countries and led by University College London. The authors set out six priorities for a health-centred response. They also recommend recognising climate change as a global health emergency through UN and WHO measures. That is a recommendation from the report's authors, not a WHO declaration. Marina Romanello, the Countdown's executive director, said the health harms of climate change are growing faster than the world's response and in many cases accelerating.
What the projections and the attribution studies add
Projections push the same direction. Researchers from IIT Roorkee, IIT Jammu, the National Institute of Hydrology and Bihar's planning department modelled 54 Indian urban areas, each home to more than a million people. They used CMIP6 models at 1.5 °C, 2 °C and 3 °C of warming. Research Matters reported on 3 November that intensity could rise by up to 35 percent in cities including Amritsar, Delhi, Kanpur, Lucknow and Bhubaneswar under higher warming pathways. Some six-day heat thresholds that were once rare could become several hundred percent more likely.
Attribution work shows what failure costs. Typhoon Dujuan tracked along Japan's east coast in September 2026 without making landfall. It killed 17 people, 10 of them in Chiba Prefecture, mostly in landslides, according to World Weather Attribution. The storm cut power to nearly 45,000 customer accounts on Tokyo Electric Power's network and breached embankments at three points around Lake Inbanuma.
Sources
6- 01GSMA warns of growing risks to mobile networks from extreme weatherEN
- 02UK.gov lacks understanding of climate impact, says watchdogEN
- 03Oregon’s extreme climate hazard days have quadrupled over 2 decades, study saysEN
- 04Climate change must be declared 'global health emergency': Lancet studyEN
- 05New climate study warns Indian cities will face harsher and longer heatwaves under global warmingEN
- 06Typhoon Dujuan: in a warming climate even well-prepared nations remain vulnerable to worsening climate extremesEN
All figures and quotations in this text come from the sources listed below.
Content prepared by the editorial team with AI assistance.
Sofia Marchetti
Comments
0- No comments yet — be the first.